
Single Point Moorings
STA specializes in the dynamic analysis of single point moorings. CALM buoys, mooring chains and underbuoy, or submarine, hoses are modelled in the time domain with OrcaFlex. Moored tankers are also modelled in the time domain with OrcaFlex with diffraction and added mass properties calculated with MDL Hydro, AQWA, WAMIT, Moses, and other frequency domain packages.
Displacement RAOs for the tankers can be quickly computed with STA BARMOT where load RAOs are not required (as is frequently the case). Preliminary static equilibrium can be quickly investigated with STA SPM.
STA SPM
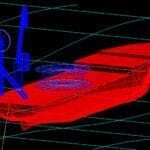
Example input and static equilibrium results for a single point moored tanker with tandem offtake tanker and tug, are shown in the figure below.

The results are shown graphically in STA SPM, as shown below. For details of this user-interactive app, view the STA SPM USER MANUAL.
While STA SPM is an efficient and very fast tool to use for static SPM equilibrium solultions, we always continue with dynamic simulations using OrcaFlex.
SQUALL, or SUDDEN WIND SHIFT CONDITIONS
An example of sudden wind speed and direction change at Covenas, Colombia, is shown below.
The x-axis grid intervals are 10 minutes each. The total sample length is 4.8 hours.
The speed starts at 15.7 knots, decreases slightly then increases to 35 knots over a time of only 80 seconds. The speed decreases fairly steadily to 22 knots at 1800 seconds. The maximum direction change is 90 degrees, with 68 degrees change during the 80 seconds of rapid wind speed increase.
COVENAS TERMINAL, COLOMBIA
Location of three SPMs (or TLUs, Tanker Loading Units) is shown above. The SPMs are operated by OCENSA and ECOPETROL.
Simplified drawing of TLU3, as used in OrcaFlex model for SPM Mooring Analysis Study by STA in 2016.
SUMMARY OF WIND SHIFT CONDITIONS MEASURED AND SIMULATED
The red circles indicate the maximum wind speeds in each simulated wind shift. The purple triangles indicate the maximum change in the wind direction simulated during the wind shift. It is important to note that, apart from WS1 (Wind Shift 1) the speed and direction changes are not instantaneous and do not occur in the same manner for the four measured wind shifts selected for analysis (WS6, WS7, WS13 and WS15). WSEP has the highest wind speed and the direction changes during the time that the wind speed is increasing.
Before a wind shift, the moored tanker tends to be headed into the wind. When sudden squalls occur, the wind direction often changes as the wind speed is increasing. The wind direction may quickly come onto the tanker beam. The tanker will be swung around as shown in the figure above.
The hawser load may cause significant heeling of the tanker during a squall.
TANKER WIND AREAS
A comparison of surge and sway wind areas is shown above for three tanker sizes, each in three different load conditions.
Unlike the wind drag coefficients, the current drag coefficients are not the same for each draft. Hence much larger ratios of the largest current force terms exist, compare to ratios of the wind force terms at different drafts.
Factors Influencing Peak Hawser Tensions
Wind Drag Force Causing Motion
Various conditions result in high peak hawser tensions. However, it can be seen from the comparisons of wind areas that much larger driving forces exist for a given wind speed on the beam in the ballast condition than in the full load condition.
It can be seen from the figures above that for a given tanker with ballast load, the sway wind area is approximately 2.5 x full load area. This means that in the ballast condition, any wind speed on the beam produces twice the driving force as in the full load condition.
Hydrodynamic (Current) Drag Force Resisting Motion
The hydrodynamic drag of the tanker hull through the water is generally a resistive term that opposes the motion of the tanker being driven by the wind. For a given tanker with ballast load, the sway hydrodynamic (current) effective drag area is approximately one tenth of the full load effective area. This means that in the ballast condition, any wind speed on the beam finds ten times less resistance to moving the tanker as in the full load condition.
Inertial Force Resisting Motion
As the tanker responds to the increased wind forces it is accelerated at a rate which is inversely proportional to its mass (and added hydrodynamic mass). Angular, or yaw, accelerations are inversely proportional to yaw inertias. In ballast conditions the tanker mass and inertia terms are about half those in the full load condition. Hence initial accelerations of a tanker in ballast are roughly twice those of a tanker in full load. With higher acceleration, the tanker can reach higher transverse and rotational velocities faster.
Hawser Peak Tensions
Peak hawser tensions during a wind shift event do not generally occur at the time when the wind is producing its maximum force on the system. They typically occur when the tanker bow has achieved a relatively high velocity moving away from the buoy. The mooring system (TLU, mooring chains, anchors and the hawser) supplies a force that decelerates the bow.
The larger the mass and inertia of the tanker, the larger is the force required to decelerate its velocity. A tanker of mass m, and velocity v, has a kinetic energy of 1/2m.v^2 (simplified as a single degree of freedom). Hence a fully loaded tanker requires roughly twice the energy to stop it as the same tanker with a ballast load moving at the same velocity.
Clearly the ballast load condition tankers have more driving force, less inertial resistance and less drag resistance during a wind shift than the full load condition tankers. Hence, if the mooring line becomes slack they can build up higher bow velocities than full load tankers. However, more force would be required to stop a full load tanker travelling at the same velocity as a ballast load tanker.
Example Results Presentation
The importance of a tug to keep tension in the mooring line is clear. It is desired to know how much tug pull will result in the lowest peak hawser tensions without running time domain simulations of specific conditions. This report provides guidance for future operations.
Peak hawser tensions are summarized in the above figure for a Suezmax size tanker at one of the three TLUs, for six different wind shift conditions, for three tanker load conditions and for 3 tug pulling conditions. The maximum dynamic hawser tensions with no tug astern pull in a sudden wind shift are always higher than those with a tug. Tug pulls of 25 tonnes, 50 tonnes and 75 tonnes are simulated. In this set of results, the 75 tonne tug pull results in the highest hawser tensions for all but two of the 6 x 3 = 18 wind shift and tanker load combinations. In the WS2 ballast condition and the WS6 ballast condition, the simulations with 25 tonnes tug pull, resulted in substantially higher maximum hawser tensions.
The short video above shows snippets of the simulations for WS2 (Wind Shift 2) for a Suezmax size tanker in ballast load condition, with no tug, then with a 25-ton tug pull, and then with a 50-ton tug pull.
UNDERBUOY (SUBSEA) HOSE ANALYSIS
The video above shows a clip from an OrcaFlex analysis of a CALM system with Chinese Lantern configuration of two underbuoy hoses.
See other software including our Catenary Anchor Chain Length Calculator and our Large Angle Stability Calculator.