|
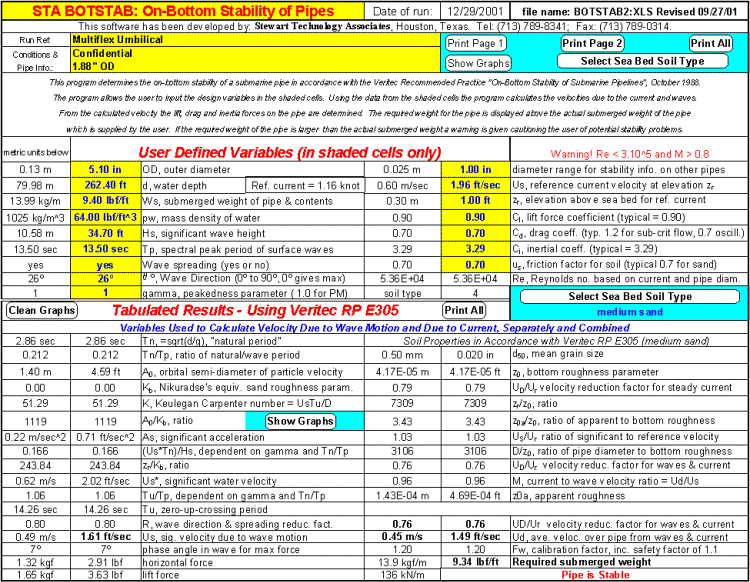
The engineer edits only the yellow shaded cells. All other data is calculated.
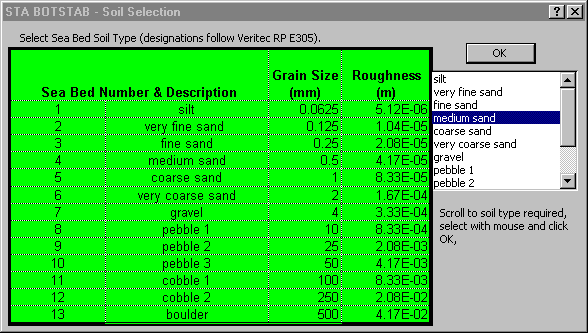
The figure below shows how the engineer simply selects the sea bed soil type.
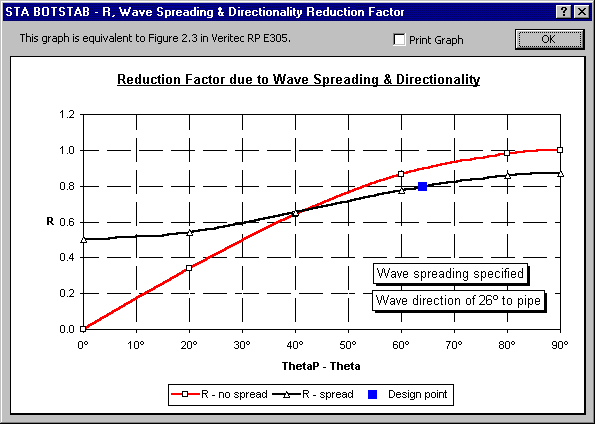
The figure below shows how the engineer simply selects what optional graphs to display.
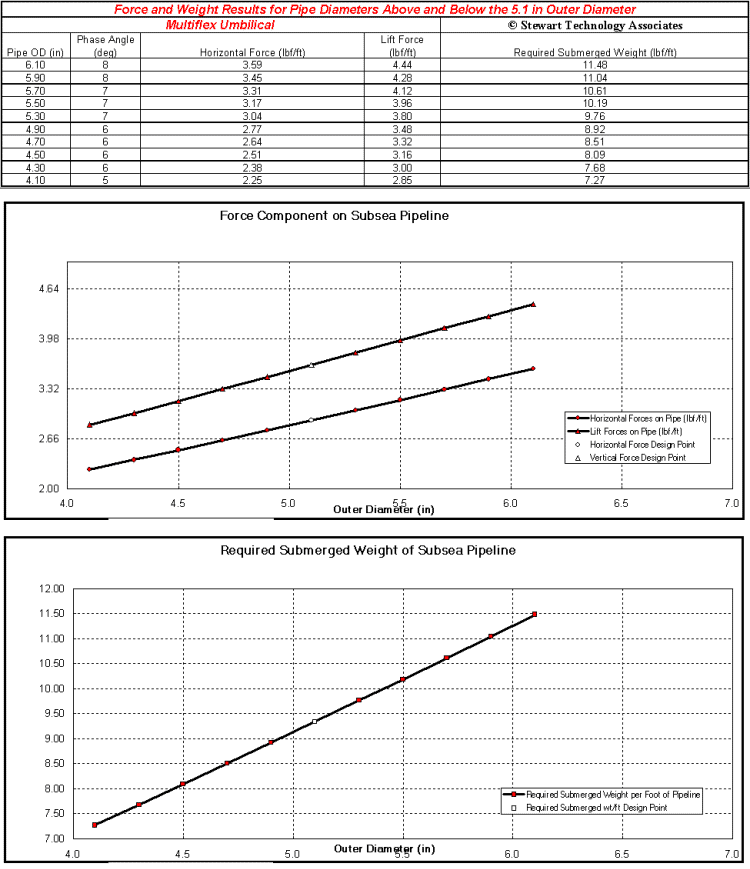
The figure below shows how the engineer simply selects to display a useful graph.
|